

I tripped over back-pressure while load-testing our Camunda cluster on STACKIT. In the end we tuned the exporter and left the broker’s flow-control settings at their defaults. If you want the measurements, they’re in Part 5 of the series. What stayed with me was the mechanism. While we were building there was never time to look at it properly, so this article does.
The question underneath: when a client sends one more command, who decides whether the system takes it, and what happens when the answer is no? Camunda 7 and Camunda 8 answer that in very different places. Camunda 7 lets the infrastructure around the engine answer: the web container, the connection pool, the database, none of which was built to say no on purpose, so the engine accepts the call, writes the work down and slows until something times out. Camunda 8 answers inside the engine. It rejects early and lets the client retry. It has to, because a log-based engine that buffered without limit would turn overload into unbounded latency and, eventually, a full disk. One gap remains with Self-Managed defaults, where the export backlog is bounded only by the disk. More on that under circuit 2.
I checked the code and config defaults against 8.10.4, the latest release as I write this; older versions may differ. The Camunda 7 side comes from its docs and how it’s built. I didn’t load-test it for this article.
Where You Come From; An Async Call To Camunda 7
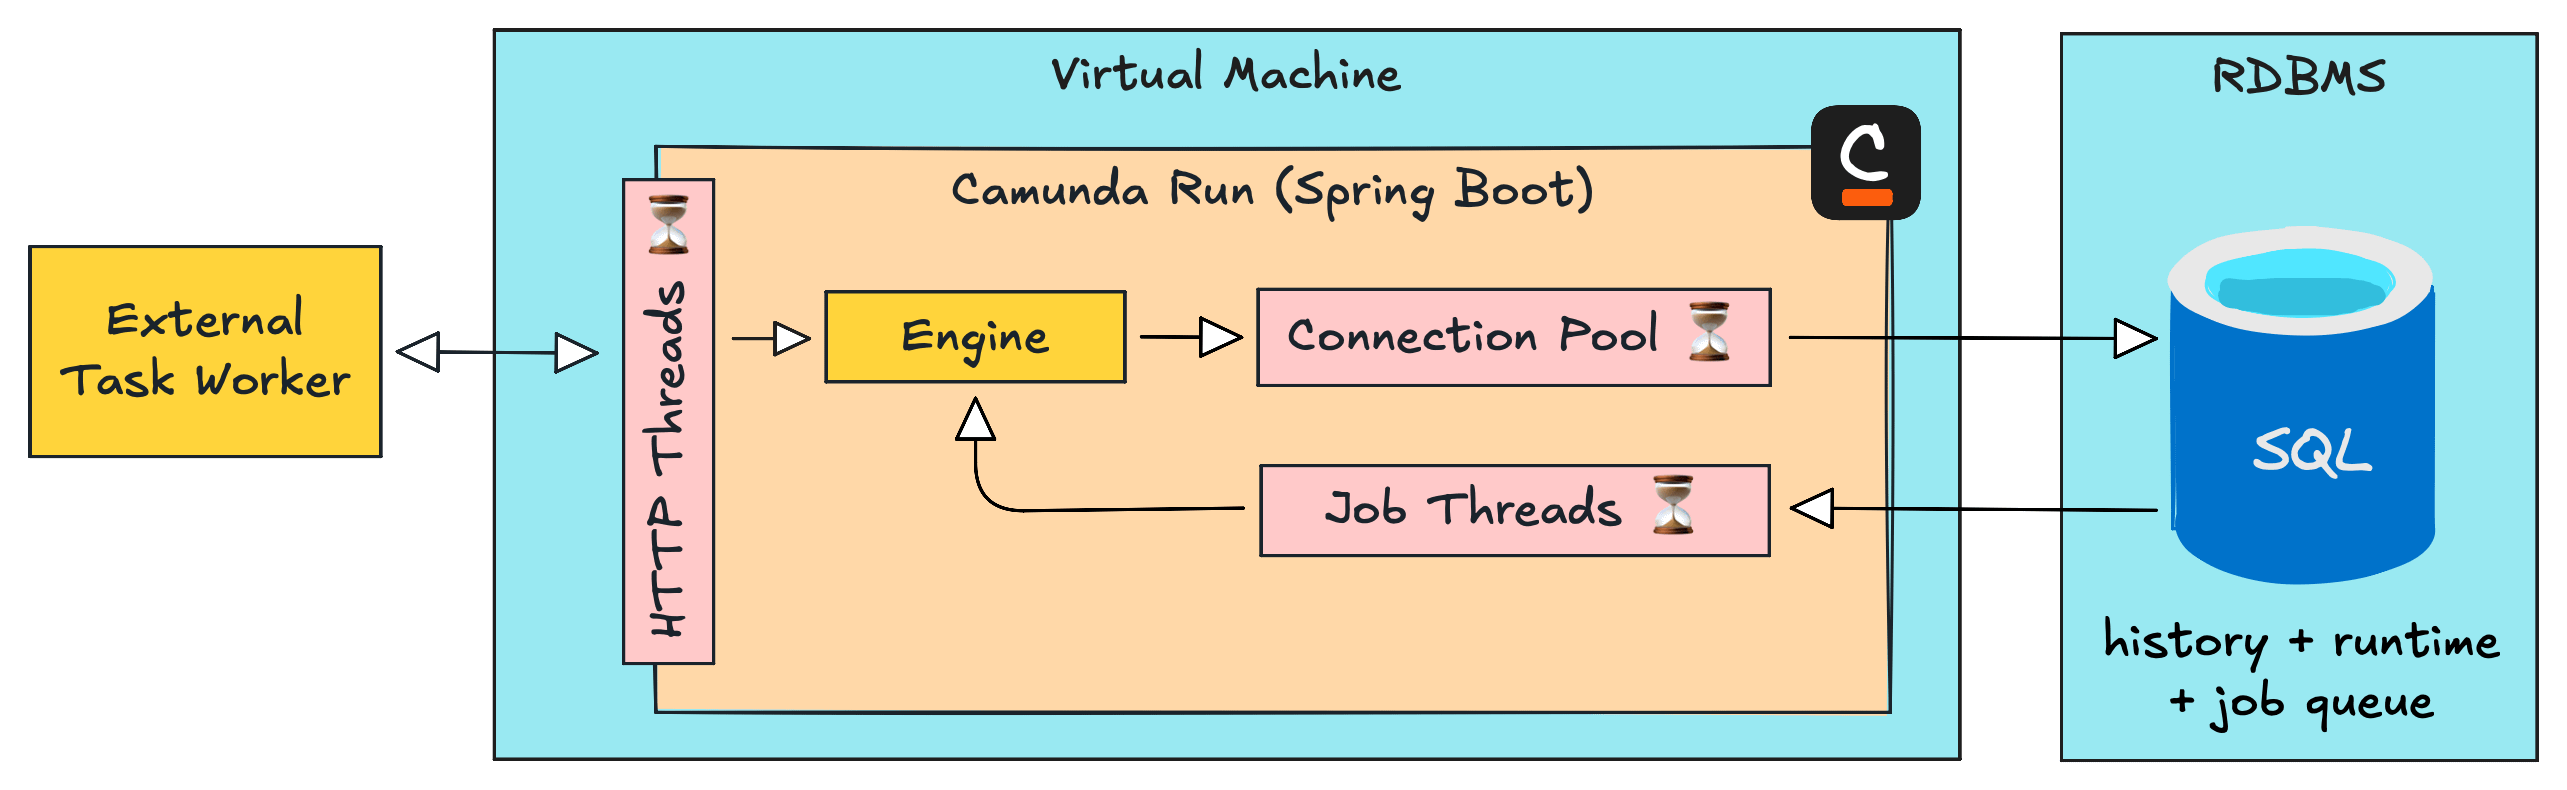
To keep the comparison fair I’ll stick to one Camunda 7 setup: a remote engine in Camunda Run, called over REST, with an async continuation on the start event, so a call only persists state and returns. External task workers fetch and lock their work. That is the closest thing Camunda 7 has to Camunda 8’s command plus job worker model, so whatever differs comes from the engines.
The call goes through the web container into the engine, which writes the instance and its job to the database, commits and responds. From there the job executor moves the instance forward, and workers fetch, lock and complete their tasks against the same database. The call itself is cheap, so the REST endpoint should stay responsive while the job table fills up behind it, and nothing in the engine looks at that backlog before taking the next call. When the database or the connection pool can’t keep up, calls get slower and then fail with timeouts or server errors. The client never gets a signal it can act on. Camunda’s best-practices guidance describes no admission control in the engine; where it mentions throttling, it means protecting the services the engine calls.
The Path Of A Command In Camunda 8
A client sends a command to the gateway, which routes it to the leader of one partition. The leader appends the command to the partition's log, replicates it to the followers and waits until it's committed. Then the stream processor reads the command back, executes it, writes the follow-up records and answers the client. Exporters read the same log afterwards and copy it into secondary storage, where Operate, Tasklist and the search APIs find it, and the log can only be compacted behind the slowest of those exporters and the latest snapshot.
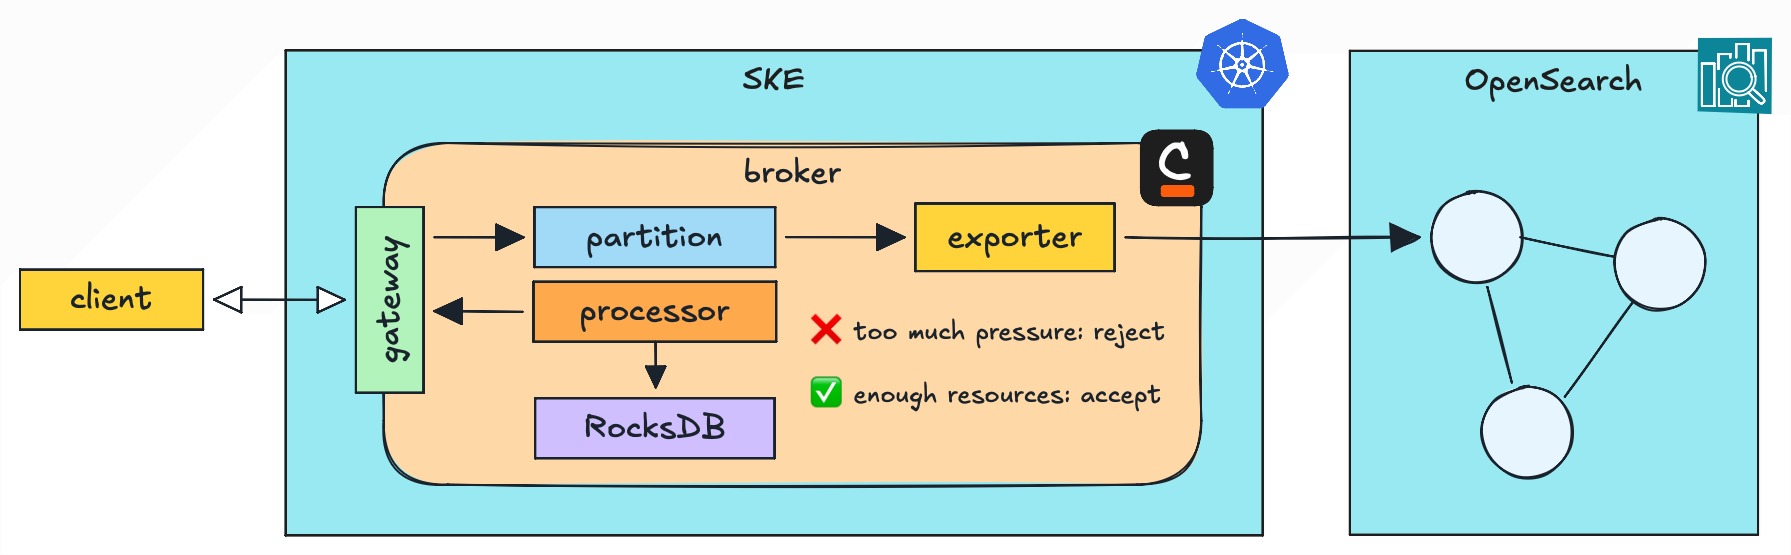
There is no shared database. State is split into partitions, each with a single writer, and work sits in order in an append-only log instead of in rows that compete for locks.
Two things matter from here on. The command is written before it’s executed, so the broker always holds work it has accepted and not answered yet. And processing and export share the log, so a slow reader at the end holds disk at the start.
Three Circuits And A Pause
Four independent mechanisms decide when the broker says no. Three of them are circuits that watch load, each at a different point: the commands in flight, the export behind them and the disk under both. The fourth is a pause, new in 8.10 and unrelated to load, so it comes last.
Circuit 1; The In-Flight Limit
Circuit 1 is about latency. Per partition, the leader counts the user commands it has accepted and not answered yet. A command is in flight from the moment it’s written until it has been processed, committed and answered. Once the count reaches the limit, new commands are rejected immediately.
The client sees RESOURCE_EXHAUSTED over gRPC, or a 503 over REST. Not a 429. The gateway has no limiter of its own, and for commands that can go to any partition it tries the next partition before giving up, while a command pinned to one partition, through a correlation key for example, goes straight back to the client.
Commands that finish or cancel work are exempt. Completing or failing a job still goes through above the limit, because work already inside has to be able to leave. Throwing a BPMN error from a job and updating job retries are not exempt, so workers can see rejections on those two calls. Unlike the next circuit, this one is on by default.
Camunda 7 caps concurrency through the size of the web container and the connection pool. Whoever sized the pools set that cap without meaning to. It works by making callers wait and knows nothing about how far behind the engine is. Starts, worker fetches and completions all queue for the same connections.
Circuit 2; The Write Rate And Exporter Lag
Circuit 2 is a limit on records written per second, with an optional throttle that shrinks that rate as the unexported backlog grows. Past an acceptable backlog, by default 100k records, the allowed rate drops in proportion. It rejects client commands, and it also slows the broker’s own scheduled writes and processing results, so the whole partition runs at the exporter’s pace.
It’s off by default in Self-Managed and on in SaaS. With it off, the first circuit only sees processing and commit, so it can stay quiet while the export backlog grows behind it. The log keeps growing and clients get no pushback until the disk runs low.
If you run Self-Managed, export lag needs its own alert.
I’d turn it on when export is your constraint and you can’t make export cheaper. If export keeps up with everything the engine accepts, the throttle caps a rate nothing ever reaches. We never turned it on: we were exporting too much data, and changing what got exported fixed it. From 8.9 the switch lives under one prefix:
camunda:
  processing:
    flow-control:
      write:
        enabled: true
        limit: 1000 # example rate, not a default
        throttle:
          enabled: true
In 8.6 to 8.8 the same settings sit under zeebe.broker.flowControl.write.*. The rate is yours to set, and I wouldn’t trust a default number, because the docs disagree on it.
Camunda 7 has nothing like circuit 2. Runtime and history live in the same database, so there’s no separate export path to fall behind.
Circuit 3; Free Disk Space
Circuit 3 watches free disk, and the broker checks it every second. By default, below 2 GB free it rejects every client command and pauses processing, and below 1 GB it stops accepting replicated events too: the log refuses to grow and compacts what it can. Both recover on their own once space is back.
The disk fills because processing and export share one log, and a stuck exporter keeps it growing however healthy processing looks. Circuit 2 is the earlier, gentler version of circuit 3. Alert on how fast the volume fills as well as how full it is, because under load the log can reach the watermark quickly.
In Camunda 7 the database itself is the buffer, with no watermark the engine respects, so I’d expect a full database to end in failed transactions.
The Pause; Leadership Rebalancing
The pause isn’t a circuit, because it doesn’t watch load at all. In 8.10, when a partition hands its leadership to another broker during a coordinated rebalance, it freezes its log. It rejects every write, internal ones included, so the new leader has a fixed log position to catch up to. Clients get the same RESOURCE_EXHAUSTED or 503, with a message saying the partition is paused for a leadership transfer.
The pause ends when the transfer succeeds or fails, and if it runs too long a watchdog makes the old leader step down. Only one partition pauses at a time, and only when someone triggers a rebalance; a crash, a normal leader election or a rolling update leaves the log alone. So if you see a short burst of rejections on one partition and nothing else looks loaded, check whether somebody just rebalanced the cluster.
Camunda 7 has no leadership to hand over, so there’s nothing to pause.
How The In-Flight Limit Moves
There is no fixed number of in-flight commands. The limit moves with what the partition observes, and an algorithm decides how.
AIMD is the default and a good one, and most setups never need to change it. It grows the limit by one while the partition is busy and answers in time, and cuts it by 10% when a command takes longer than the default request timeout of 200 ms. It only grows while the partition is at least half full. By default it starts at 100 and moves between 1 and 1,000. As far as I can tell, it’s also the only one you can point at a latency target. If you do touch something, change that request timeout before you change the algorithm. Both sit in the snippet below.
AIMD and Vegas are TCP congestion-control algorithms. Gradient and Gradient2 are Netflix’s own, from their concurrency-limits library, which builds on the same TCP ideas. A partition limiting unanswered commands has the same problem as a TCP connection limiting unacknowledged packets.
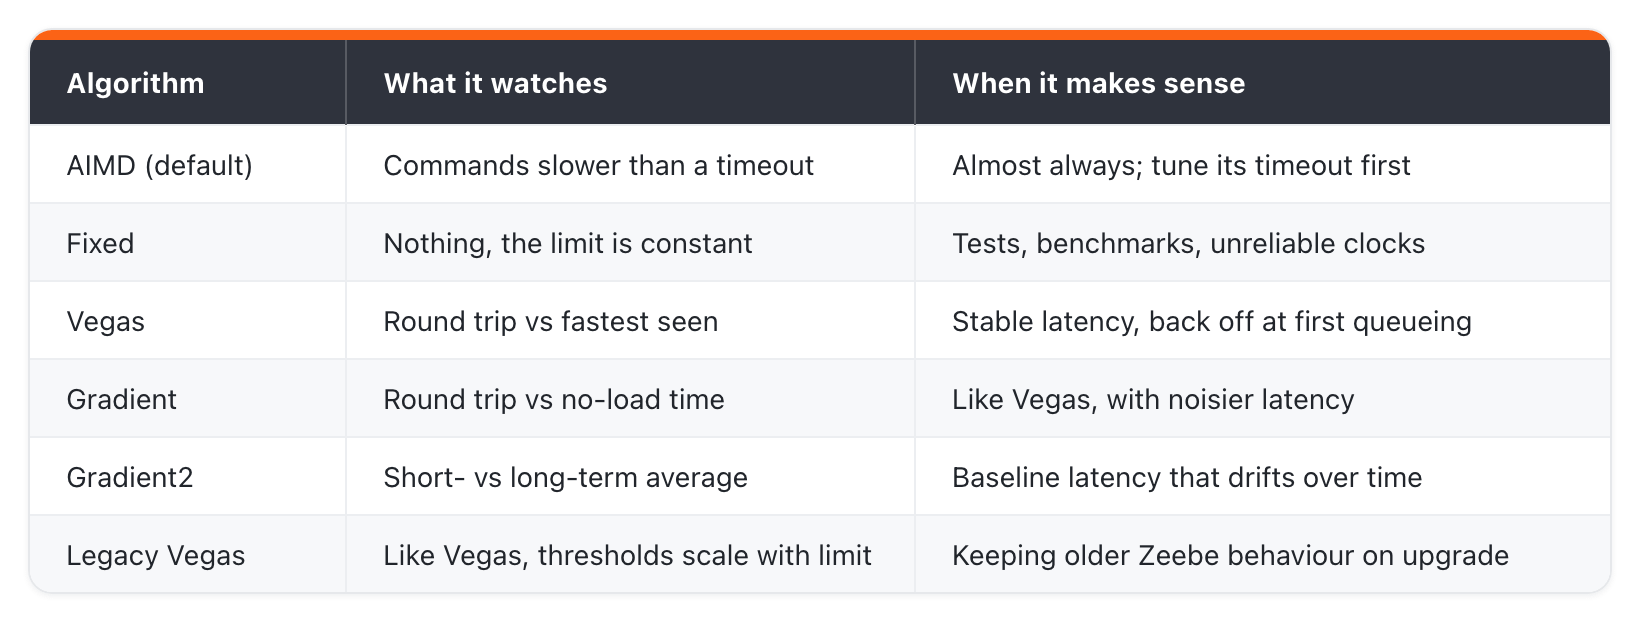
Camunda’s docs give no guide for choosing between them, so the last column is my reading, not Camunda’s. Fixed makes sense in a benchmark, where you want the limit out of the equation. The docs also suggest it when the node’s clock is unreliable. I’d look at Gradient2 if your baseline latency drifts, on shared storage or a busy network for example. Legacy Vegas mimics the old Zeebe defaults, for keeping old behavior on an upgraded cluster. Switching is one line, and AIMD’s timeout sits right next to it:
camunda:
  processing:
    flow-control:
      request:
        algorithm: aimd # fixed, vegas, gradient, gradient2, legacy-vegas
        aimd:
          request-timeout: 200ms # the default
In 8.8 and earlier the setting lives under zeebe.broker.flowControl.request.*, or zeebe.broker.backpressure.* on older clusters. The nearest Camunda 7 equivalent is a thread pool size you set once and hope still fits under load.
Two Systems, Two Contracts
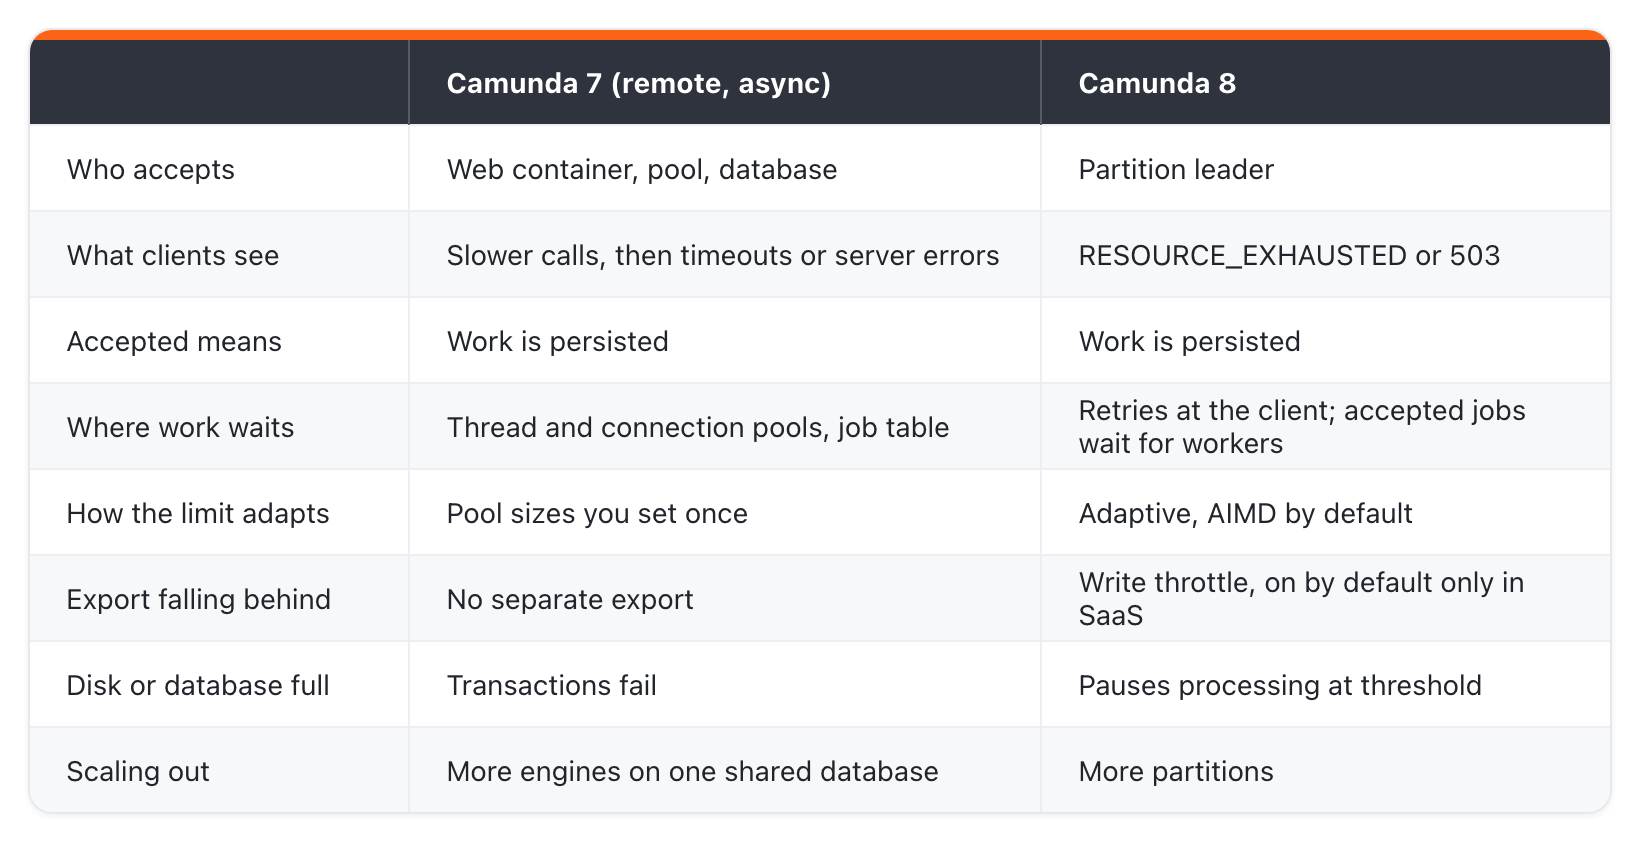
In this setup an accepted request means the same thing in both products: the work is persisted.
Camunda 8 builds a backlog too: jobs waiting for workers. None of the circuits watches your workers. Where the two differ is command admission, and what that makes the client responsible for.
If you’re coming from Camunda 7, this is where old habits bite. Against a Camunda 8 broker, a rejected request is normal operation. A retry loop, timeout or alert built for a system that waits does the wrong thing against one that says no. A client that treats RESOURCE_EXHAUSTED as a failure gives up on work the broker would have taken shortly after, and an alert on every 503 fires whenever the broker does its job.
Summary
The client owns the retry now, and the Java client leaves most of it to you. Its job workers back off on their own when polling gets rejected. Commands don’t: their retries are off by default, and the retry policy you can switch on with useDefaultRetryPolicy covers gRPC only, not REST. The Spring Boot starter can retry completing, failing and throwing errors from jobs after a rejection, but camunda.client.worker.defaults.max-retries is 0 by default. A client that backs off lets the in-flight count drain, and once commands are answered inside the timeout again the limit recovers.
Retry with backoff and jitter in every client that sends commands.
Make retries idempotent. A timeout doesn’t prove the command failed, in either product.
Watch one signal per circuit.
Circuit 1: rejected requests (
zeebe_dropped_request_count_total, which counts rejections from every circuit, the pause included) and the current limit (zeebe_backpressure_requests_limit).Circuit 2: export lag, the committed position (
zeebe_log_appender_last_committed_position) minus the exported one (zeebe_exporter_last_exported_position), as in Camunda’s Grafana dashboard.Circuit 3: free disk and its fill rate from your volume metrics, since the broker exports no disk metric.
Watch the job backlog as well.
Decide consciously about circuit 2 in Self-Managed.
On STACKIT circuits 1 and 3 stayed at their defaults, and our work went into the exporter. Having gone through the mechanism now, I’d make the same call again: they regulate themselves.